Australia: all-cause deaths up 17.1%

Official Australian stats1Archive versions of that page here and here. show 17.1% more deaths than expected in 2021-2022. Here’s their main graph – to which I’ve added southern hemisphere seasons.

Initially the ‘with and without Covid’ approach distracted from the key metric: all-cause deaths (red line).

But, once focused I began comparing the red line to the baseline range (light blue zone)… and recalled something my statistics lecturer in university said: the height of the curve is not as important as the total area under it.

So I found myself wondering:
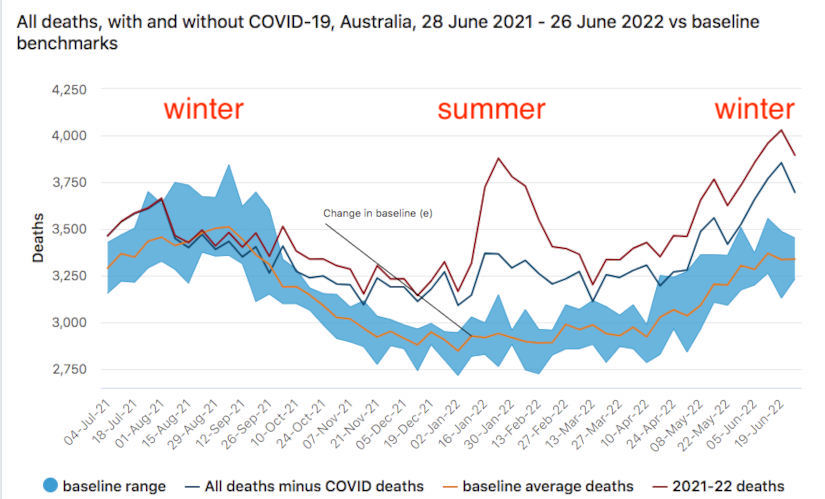
  • why did deaths in this particular Australian summer so greatly exceed
    1. the normal summer range and
    2. also that of the previous winter?2The chart’s language and design suggests these summer deaths are Covid related. But since when did respiratory viruses do more harm in summer than winter?!
  • why are deaths this current winter so much higher than in the previous, less-vaccinated winter?!
  • why are Australian all-cause deaths trending upwards and not returning to normal seasonal ranges – just like we see in:
    1. Rancourt’s USA findings
    2. Engler’s Lombardy analysis3see the final chart I included
    3. Euromomo
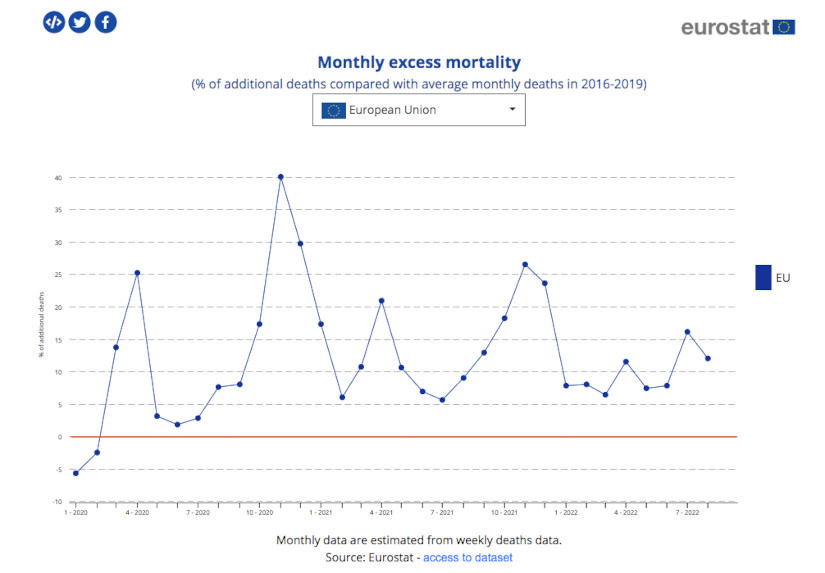
    4. Eurostat (I’ve highlighted baseline “0” in their graph)
Who could have seen this coming?

Stats people like Joel Smalley as it happens. In May he posted:
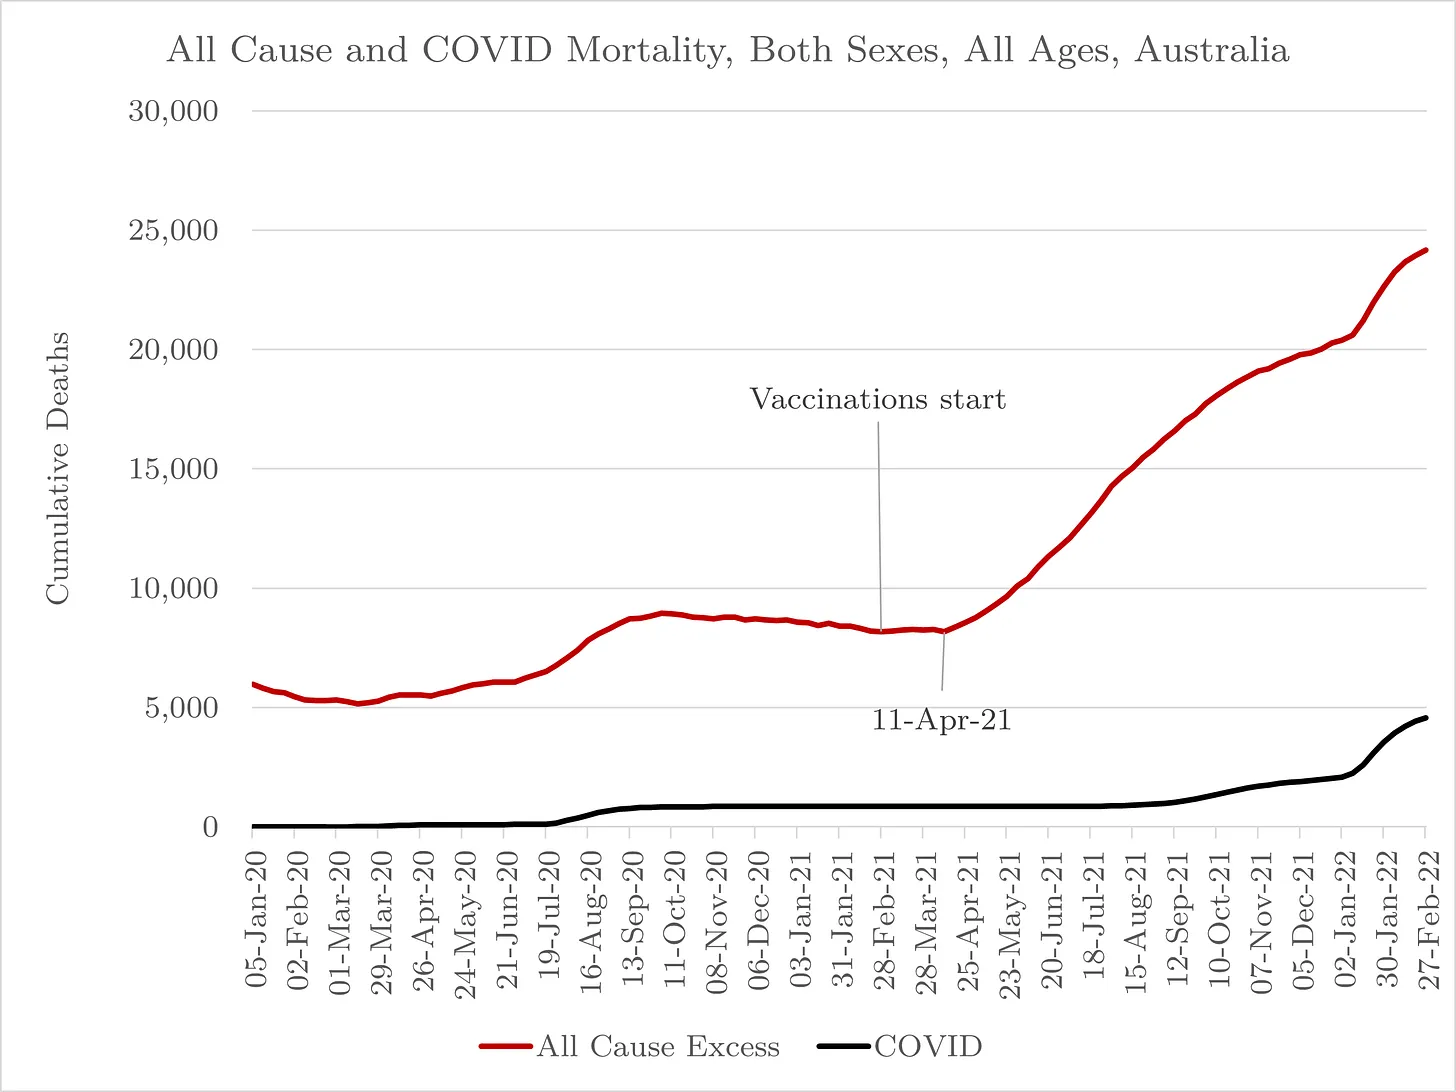
Australia begins to reap what it has sown. It’s grim.

Dr. John Campbell went in to more detail about Australia.

Thanks to checkur6 for highlighting these stats at the end of the latest Young Hearts vid.

  • 1
    Archive versions of that page here and here.
  • 2
    The chart’s language and design suggests these summer deaths are Covid related. But since when did respiratory viruses do more harm in summer than winter?!
  • 3
    see the final chart I included
Young Hearts 25

Uncharted Waters (Pfizer confirms)

Pfizer made a stunning admission this week in an EU Parliament that they did ‘no testing for transmission’, before releasing it onto the market.
Dr Birx recently admitted that she “knew it wouldn’t stop transmission” and they “overplayed the vaccine”
Barack Obama stated in April 2022 that “we’ve now essentially clinically tested (chuckle) the vaccine on billions of people worldwide”

Continue reading Young Hearts 25

Death in Europe, All Ages and Children – 2017 to 2022

I don’t know about other data analysts, but with three children of my own under the age of 14, I can’t help but cry when I do these analyses.

Joel Smalley
Weekly Average Excess Deaths, 0 to 14 Year Olds, Europe – source: EuroMOMO (euromomo.eu) 2022

Literally counting the deaths, he asks…

Continue reading Death in Europe, All Ages and Children – 2017 to 2022

The Lombardy Analysis

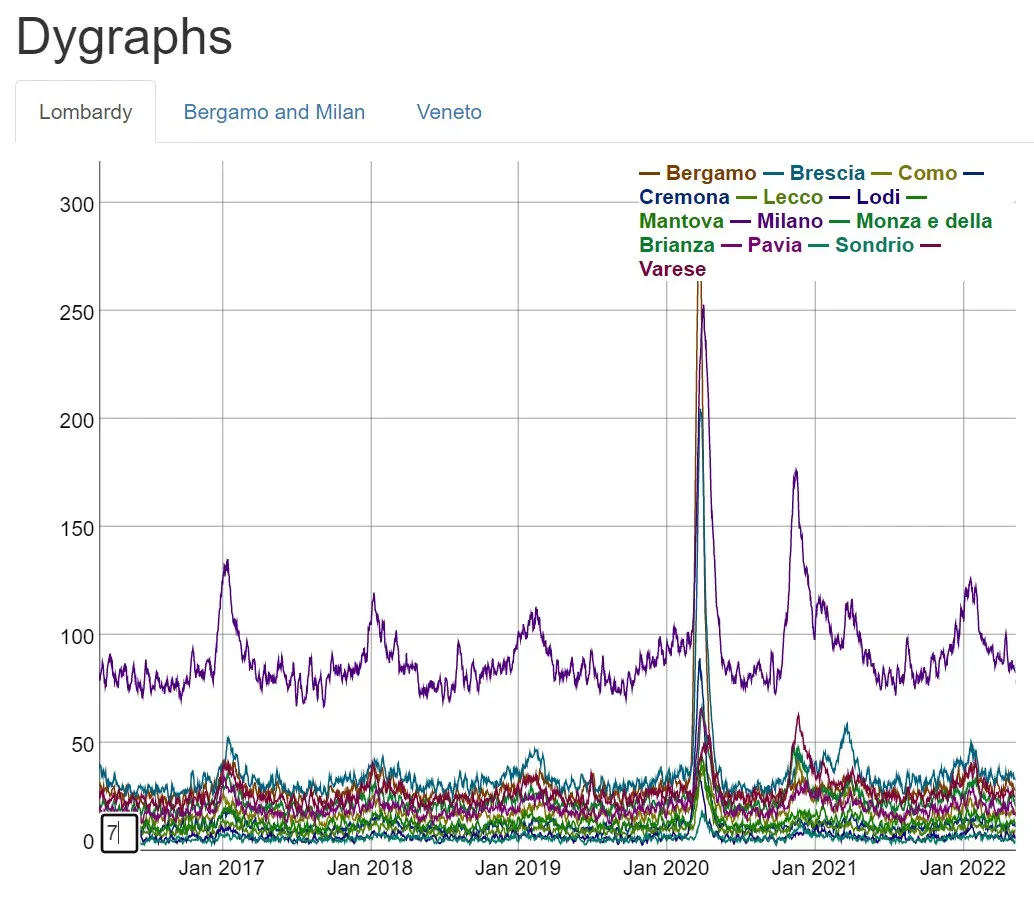
A pattern difficult to explain by viral spread.1An article by eugyppius (The Earliest Days of the Italian Pandemic, or: Why Nobody Wants To Talk About February 2020 Anymore) got Jonathan Engler digging in the Lombardy regional death data.

The first thing to note… is the extreme synchronicity of the excess death curves… surprising in the context of a “spreading” virus. The next thing to note is the height and sharpness of the peaks in deaths.

This extremely rapid rise and fall, to unprecedented levels, also seen synchronously elsewhere in Lombardy, does not look at all natural. However, it does resemble another, non-viral incident. In 2003 there was a huge spike in elderly deaths in France, triggered by a heatwave…

Continue reading The Lombardy Analysis

Seven simple questions for the unenlightened

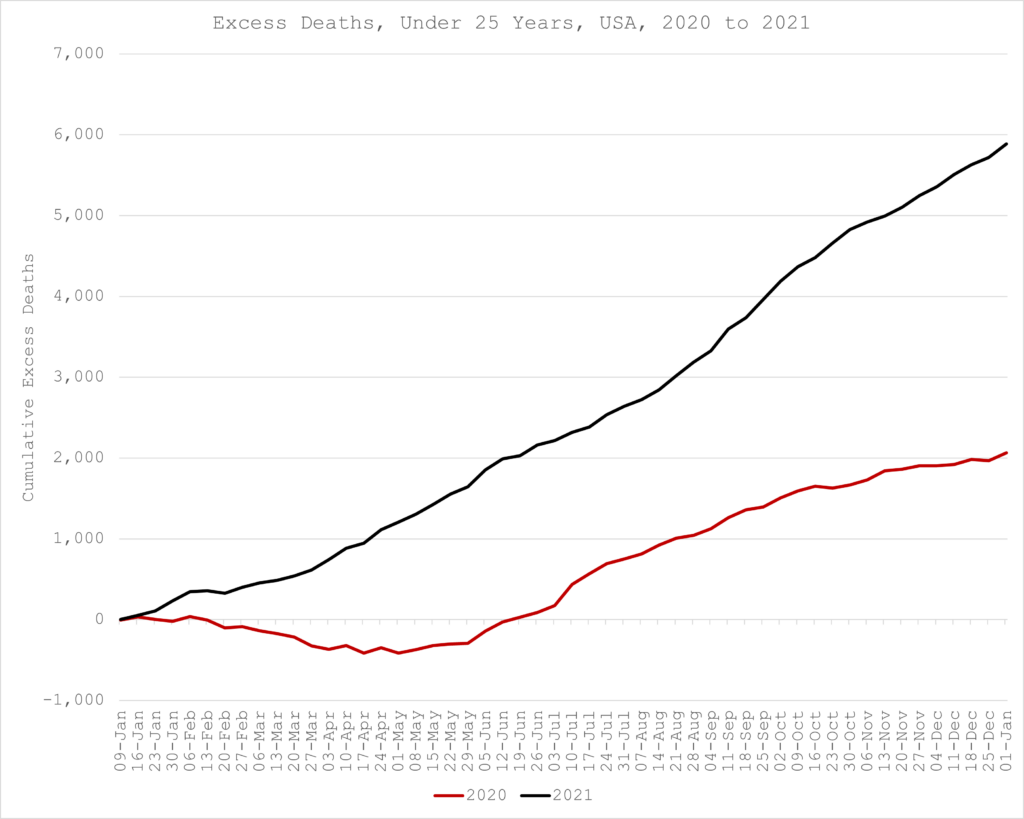
COVID mostly affects the over 65s.

So what would you expect to see when you look at younger age groups and compare

  • excess deaths1As a certain number of deaths are statistically expected each week/month/year ‘zero’ excess deaths means people were dying in normal numbers. So, below the zero line indicates fewer deaths than expected, above indicates more than expected. in 2020 (when COVID was ‘new’) with
  • excess deaths in 2021 (when the miracle shots came into action)?

Why is the “vaccine” year so much higher than the virus year and where is the declaration of a public health emergency?

Joel Smalley

His charts, explanations and resulting questions are worth the five minute read.

  • 1
    As a certain number of deaths are statistically expected each week/month/year ‘zero’ excess deaths means people were dying in normal numbers. So, below the zero line indicates fewer deaths than expected, above indicates more than expected.

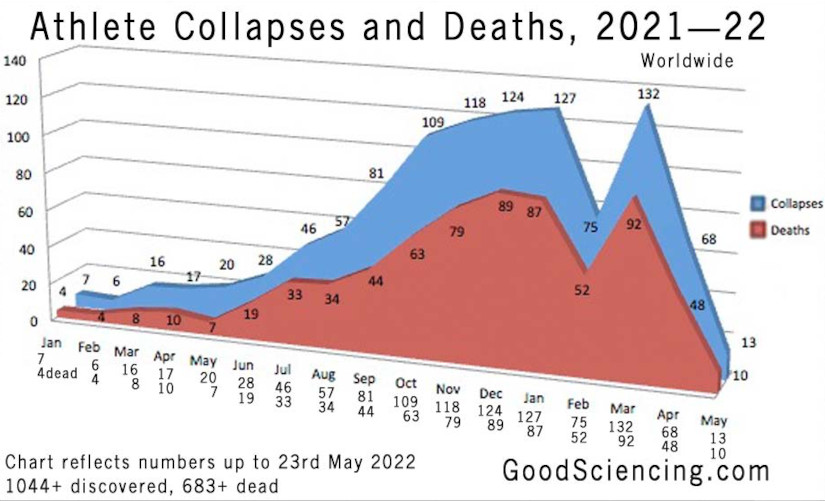
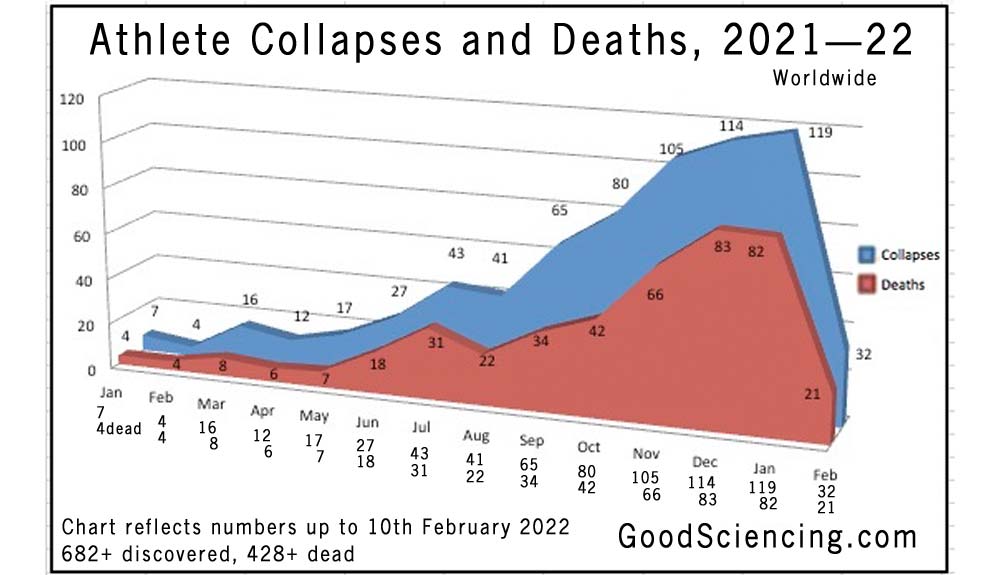
1111 Athlete Cardiac Arrests, Serious Issues, 732 Dead, After COVID Injection

For context:

The International Olympic Committee in Lausanne, Switzerland, studied documents from international data banks from 1966 to 2004. Those documents indicate 1,101 sudden deaths in athletes under 35 years of age, an average of 29 athletes per year, the sports with the highest incidence being soccer and basketball. (NIH Document)

A study by Maron on sudden death in US athletes, from 1980 to 2006 in thirty-eight sports identified 1,866 deaths of athletes with cardiac disease, with a prevalence of hypertrophic cardiomyopathy.

2005 to 2006 averaged sixty-six (66) deaths per year, with 82% of those occurring during competition or training.

GoodSciencing.com

Now 745 heart attacks, 477 dead…

… according to the ever-growing, regularly updated Good Sciencing page.1Wayback snapshot.

Readers are writing to us asking for comparisons from previous years. Some say without that, these results mean nothing. That’s not true because if we had seen this in previous years, it would be well known and others would have documented it. We are starting to work on this – it is a lot of work.

Where are the fact-checkers? Where is the mainstream media? Some have piles of money from Bill Gates. Why are they not proving us wrong by all piling on and showing the documented Athlete deaths from 2019, 2018, 2017 and the previous decade?

They are nowhere to be found because this number of athlete deaths is abnormal and they know it. They have money from people who don’t want journalists poking around. So that’s why they don’t try to thoroughly Fact-Check these reports or show previous year numbers.

Good Sciencing

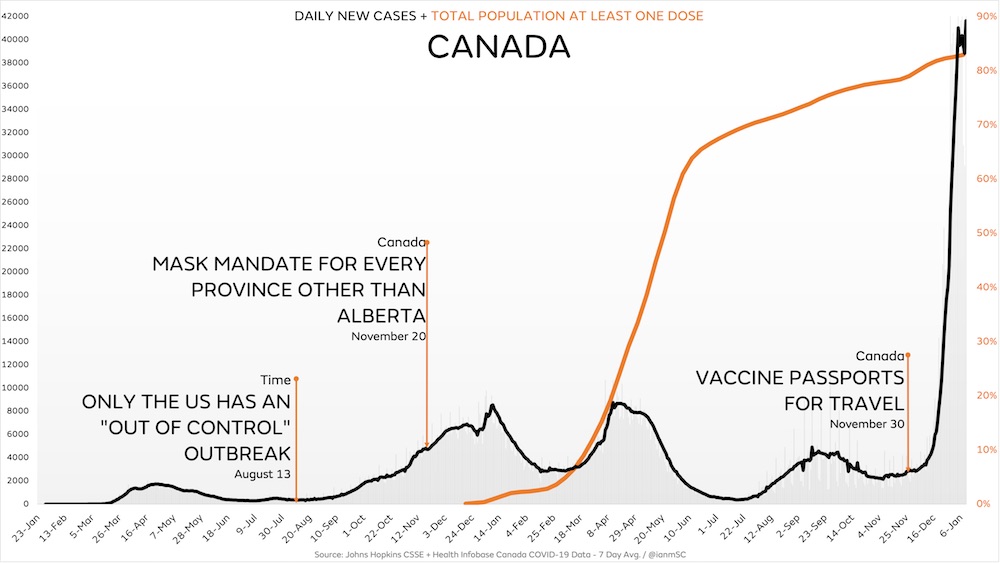
Justin Trudeau Destroyed Canada to Extend Policies That Have Already Failed

According to data and chart guy, Ian Miller.

He seems to make a good case. What do you think?

(P.S. He’s not saying it out loud, but his charts of the Canadian provinces, and Iceland, are each “black swans“. Ordinarily in science just one black swan would vanquish a hypothesis. But despite there now being quite a flock of them disproving COVID policies, some people still religiously follow The ScienceTM… even as it destroys them, their families, friends… and countries.)

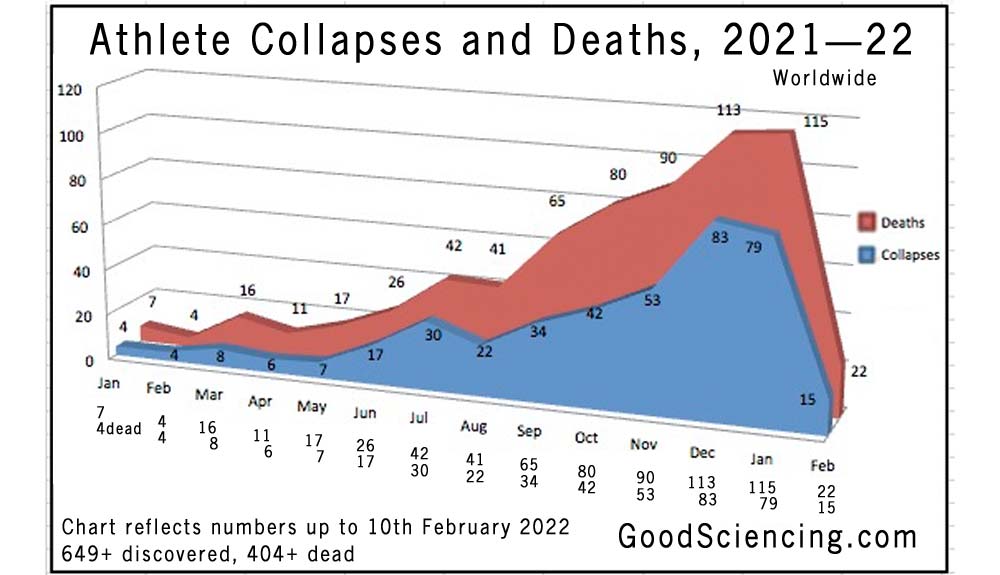
404

On the internet 404 usually indicates a problem with a website.

But today on the internet it is also the number of athletes whose sudden deaths have been recorded on this ever-growing page of Good Sciencing.1Wayback snapshot for posterity

I see some Twitter remarks by my compatriot, former soccer player Gary Dempsey, are pictured also.

I wonder if Twitter will caution or ban him for talking about his experience and feelings? Because that kind of sharing could create vaccine hesitancy – something no longer condoned by the private companies and governments determining what we, the people, are free to speak about.


The Vaccine Effects

Pandemic of the unvaccinated?

Yes, it is. Depending on how you define “vaccinated” and WHEN you record deaths.

Vaccines aren’t causing excess deaths?

No, they are not. Depending on how you define “vaccinated” and WHEN you record deaths.


Ivor Cummins explains how overall mortality and ICU usage can be made appear higher amongst “unvaccinated” people.

The Vaccine Effects – Mortality MAGICK

The Vaccine Effects – ICU MAGICK


Ivor referenced this presentation by Prof. Norman Fenton in the UK from last November. (If you want to understand the Professor’s background and approach, restart the video from the beginning. But be warned. You’ll also learn about other issues with the official data.)