Neuro-biologist JJ Couey, reviews Nick Hudson’s Oct 11th presentation to the Actuarial Society of South Africa. A plain version can be watched on Pandata.org
Transcript
Copied from the Pandata substack. Contains an Addendum responseding to some questions he was asked on the day…
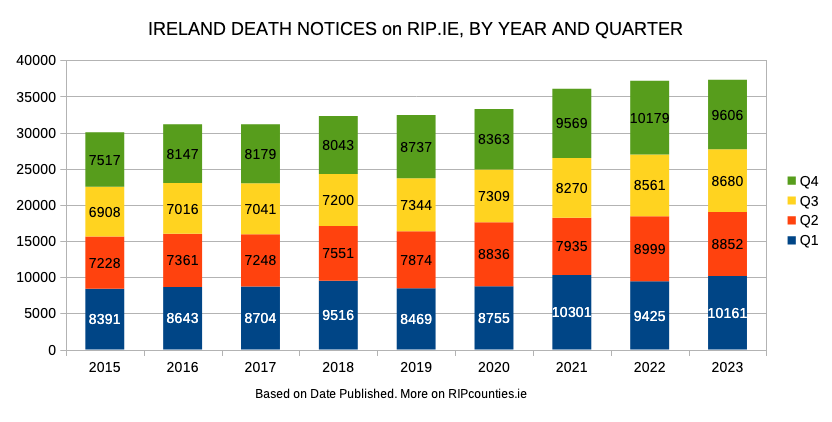
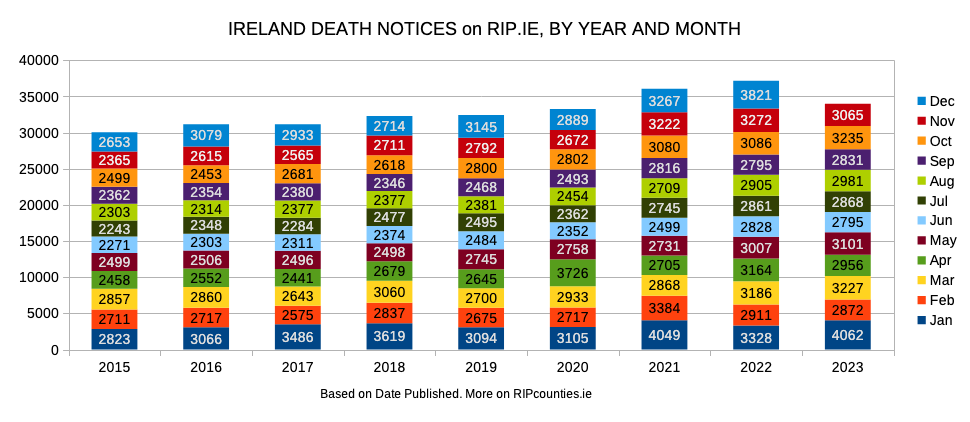
Today, Ireland Excess Deaths, Irish Quislings and RIP Counties each updated with their November numbers. Thankfully, this November seems less harsh than Nov ’22 and Nov ’21. But still way above pre-scam Novembers.
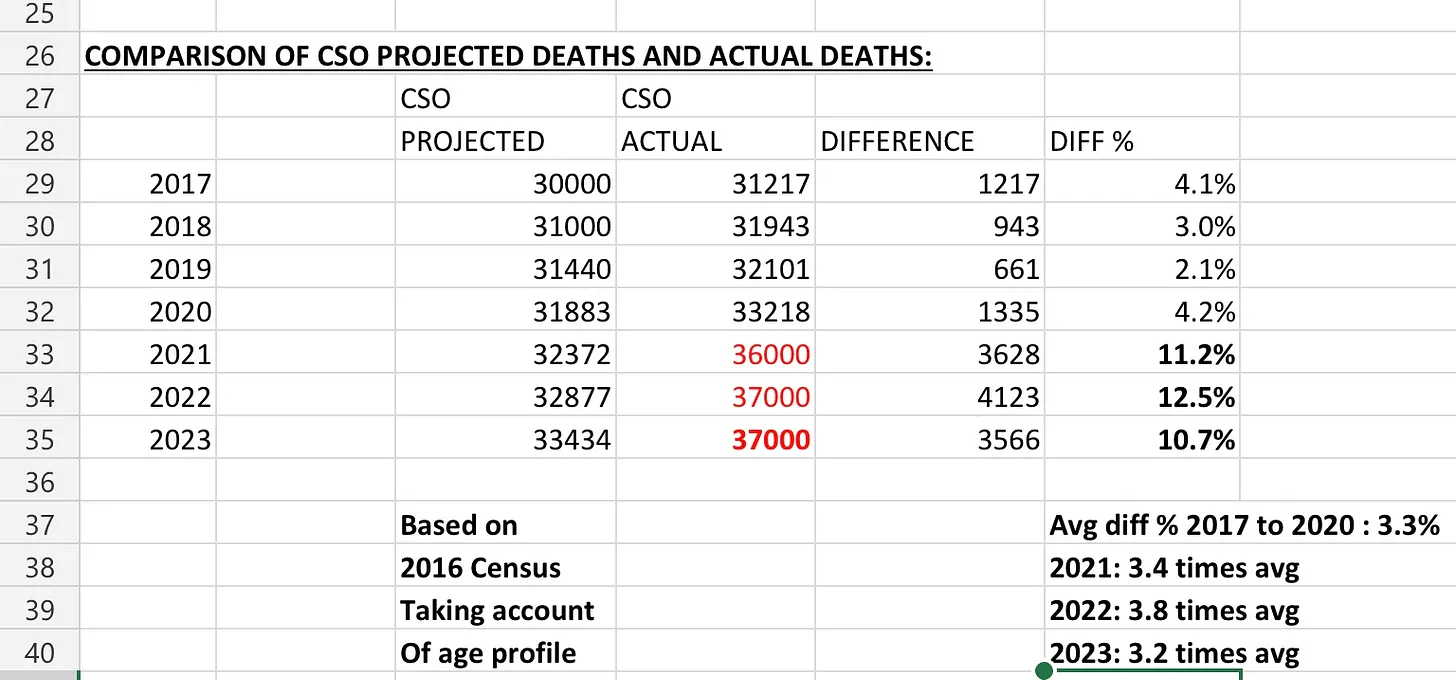
Also, more people have died in eleven months of 2023 than in the whole ‘novel virus’ year – the year we (supposedly) had no natural immunity nor injections to save us.
Good job those transfections started in Jan ’21 just as the deaths really started accelerating, eh?! It’d have been so much worse if those counter-measures hadn’t been deployed just then. Just in time.1Sarcasm
And no, this does not show lockdowns, masks and standing on circles in shops saved us in 2020. Because if they had saved us that year, why did they stop saving us from Jan ’21 on? (You might remember we were also doing those things for about the first half of 2021 – while the transfection roll-out was ramping up?).
Denis Rancourt is interviewed by JJCouey about his paper which evaluates whether the Nobel-Prize-winning COVID-19 vaccine has actually saved millions of lives.
Looks like it comes down to the assumptions made when inputting data into the model… and the credulity of those accepting the models answers as real.
If you really want to dive in, helpfully Rancourt has provided links to some resources mentioned.
“… the different lots, the amount of damage they cause, is mathematically precise… it’s very, very high tech medicine that’s going on…
Craig Paardekooper (@38:03)
Mike Yeadon has wondered if the roll-out of the Covid-19 injections was a trial-run to calibrate a weapon.
Has Craig Paardekooper found corroborating evidence? He wants other data people to check his work. The data can be found on HowBad.info
(Know anyone into data? Please share this post with them).
Background: 5% is the magic number
In August he told the Corona Investigative Committee about anticipating that the rate of side-effects from the Covid-19 injections would be kept to 5% or less – because it’s a threshold between us noticing when something is happening by chance or intention.
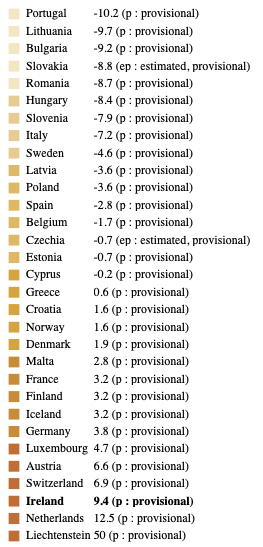
Apologies for the small text on the bar chart. But that’s how it exports from Eurostat.
Vertical centre line = average monthly death rate (so excess is 0%). Left/ Right of that line = percentage below / above average.
Eurostat Interactive Tool
Use the interactive tool to select Ireland and compare it with the EU average. As you do I invite you to ponder a question: why aren’t Irish excess deaths coming down in the Summer like they’re supposed to?
A member of Mark Crispin Miller’s team gives a breakdown of their methodology, some history of that obituary phrase and how the media has been deployed to NORMALIZE this ongoing catastrophe.
Apologies for the small text on the bar chart. But that’s how it exports from Eurostat.
Centre = average monthly death rate (so excess is 0%). Left/ Right = percentage below / above average.
Eurostat Interactive Tool
Use the interactive tool to select Ireland and compare it with the EU average. As you do I invite you to ponder a question: why aren’t Irish excess deaths coming down in the Summer like they’re supposed to?
Here are four authors presenting ambulance call out data which show (yet again) that the official COVID narrative is flawed.
1. Oisín Page – about Dublin
Dublin City Council ambulance datasets show:
2020 was a quiet year, despite a ‘deadly’ virus rampaging amongst us. You may remember the media announcing death tolls for months on end that year. With that much death attributed to COVID-19 why do the Dublin ambulance statistics show less call outs during that time instead of more?
things seem to be worsening since Quarter 2, 2021. Particularly striking for me is the change in seasonal patterns – with Summer and Autumn Call Outs reaching Winter levels.
The graph above shows the total Call Outs, per month, for all categories of “Criticality” combined:
(A) Alpha = Non serious or life threatening
(B) Bravo = Serious not life threatening urgent
(C) Charlie = Serious not life threatening immediate
(D) Delta = Life threatening other than cardiac or respiratory arrest
(E) Echo = Life threatening Cardiac or respiratory arrest
(O) Omega = Minor illness or injury
Null / Not Classed
I won’t flood you here with graphs for each of those categories – especially as the changes in most are not all that remarkable.1If curious, you can explore them in my spreadsheet (.ODS, 60MB). But one category stands out:
From Autumn 2021 onward “Life-threatening Cardiac or respiratory” Call Outs are generally above normal seasonal levels… and the jump up for December 2022 is remarkable.
Oisín: the Aug-Sept 2016 jump may be due to reclassification of type D call outs which show an unusual drop at that time. That, plus other oddities in the pre-2016 datasets, suggest those older datasets are less reliable. So they were discounted.
What happens in January 2023?
The datasets I found contained 2 or 3 years in each document. If Dublin City Council keep that publishing pattern, we may have to wait until 2025 to find out what happened in 2023 and 2024.
The ‘Out-of-Hospital Cardiac Arrest Register’ (OHCAR) reports annually to the National Ambulance Service of Ireland on cardiac incidents measured as per their annual report…
The highlights are as follows:
2021 EMS Cardio Incidents are 21.2% up on 2020
2021 EMS Cardio Incidents are 13.3% up on 2019
The rate per 100k population has increased accordingly
Interestingly, the median age in 2021 has fallen to 67 after 4 years at 68…
If COVID-19 Was so Horrific and the ‘Vaccines’ Were so Effective, This Should Show Up in Emergency Medical Services Data, Shouldn’t It? …
I drew red lines over the years 2019, 2020, 2021, and 2022 to indicate the mean call volume for each. I only focused on emergency calls (the black bars) since they are the ones that people are most concerned about. Once again, the call volume for emergency medical services dropped in 2020 and then increased in 2021-2022. This is further evidence that contradicts the idea that paramedics were busier than ever in 2020, but then relieved of the excessive workload once most people were coerced into getting COVID-19 shots.
… Contrary to the impression given to the public, emergency department visits dropped by as much as 60% in this period (Figure 4); ambulance arrivals to hospitals decreased by 29% (Figure 5)…
… 5,300 additional deaths occurring at home … are corroborated by a 285% increase in patients pronounced dead at the point of ambulance dispatch pickup (Figure 7). Most of this increase was heart-related deaths– an inevitable consequence of telling people to stay away from hospitals for anything that wasn’t potentially a severe symptom of Covid.
Full article here. See also her discussion with JJ Couey and presentation to PANDA.
Co. Kilkenny accountant Patrick E Walsh breaks down the Eurostat monthly excess death figures for Ireland which point to a worrying trend since the roll-out of the experimental vaccines.
Thanks to the cryptic Sage Hana for bringing Jessica Hockett to my attention. Her recent chat with JJ Couey is littered with pertinent questions. Sage highlighted a few…
If the novel respiratory virus is killing people like crazy, shouldn’t it have been preceded by the ER1Emergency Room death numbers?
… Where were all the bodies?
27,000? Huh? The freezer trucks were not full, no matter what Donald2Donald Trump said. The hospitals were not full.
Why didn’t the same pathogen wipe out people in other cities at the same “smart bomb” rate. 247% increase across all ages?
To provide the best experience, Oisin.Page uses technologies like cookies to store and/or access device information. Consenting to these technologies allows processing of data such as browsing behaviour or unique IDs on this site. Not consenting or withdrawing consent, might affect certain features and functions.
Functional
Always active
The technical storage or access is strictly necessary for the legitimate purpose of enabling the use of a specific service explicitly requested by the subscriber or user, or for the sole purpose of carrying out the transmission of a communication over an electronic communications network.
Preferences
The technical storage or access is necessary for the legitimate purpose of storing preferences that are not requested by the subscriber or user.
Statistics
The technical storage or access that is used exclusively for statistical purposes.The technical storage or access that is used exclusively for anonymous statistical purposes. Without a subpoena, voluntary compliance on the part of your Internet Service Provider, or additional records from a third party, information stored or retrieved for this purpose alone cannot usually be used to identify you.
Marketing
The technical storage or access is required to create user profiles to send advertising, or to track the user on a website or across several websites for similar marketing purposes.