COVID mostly affects the over 65s.
So what would you expect to see when you look at younger age groups and compare
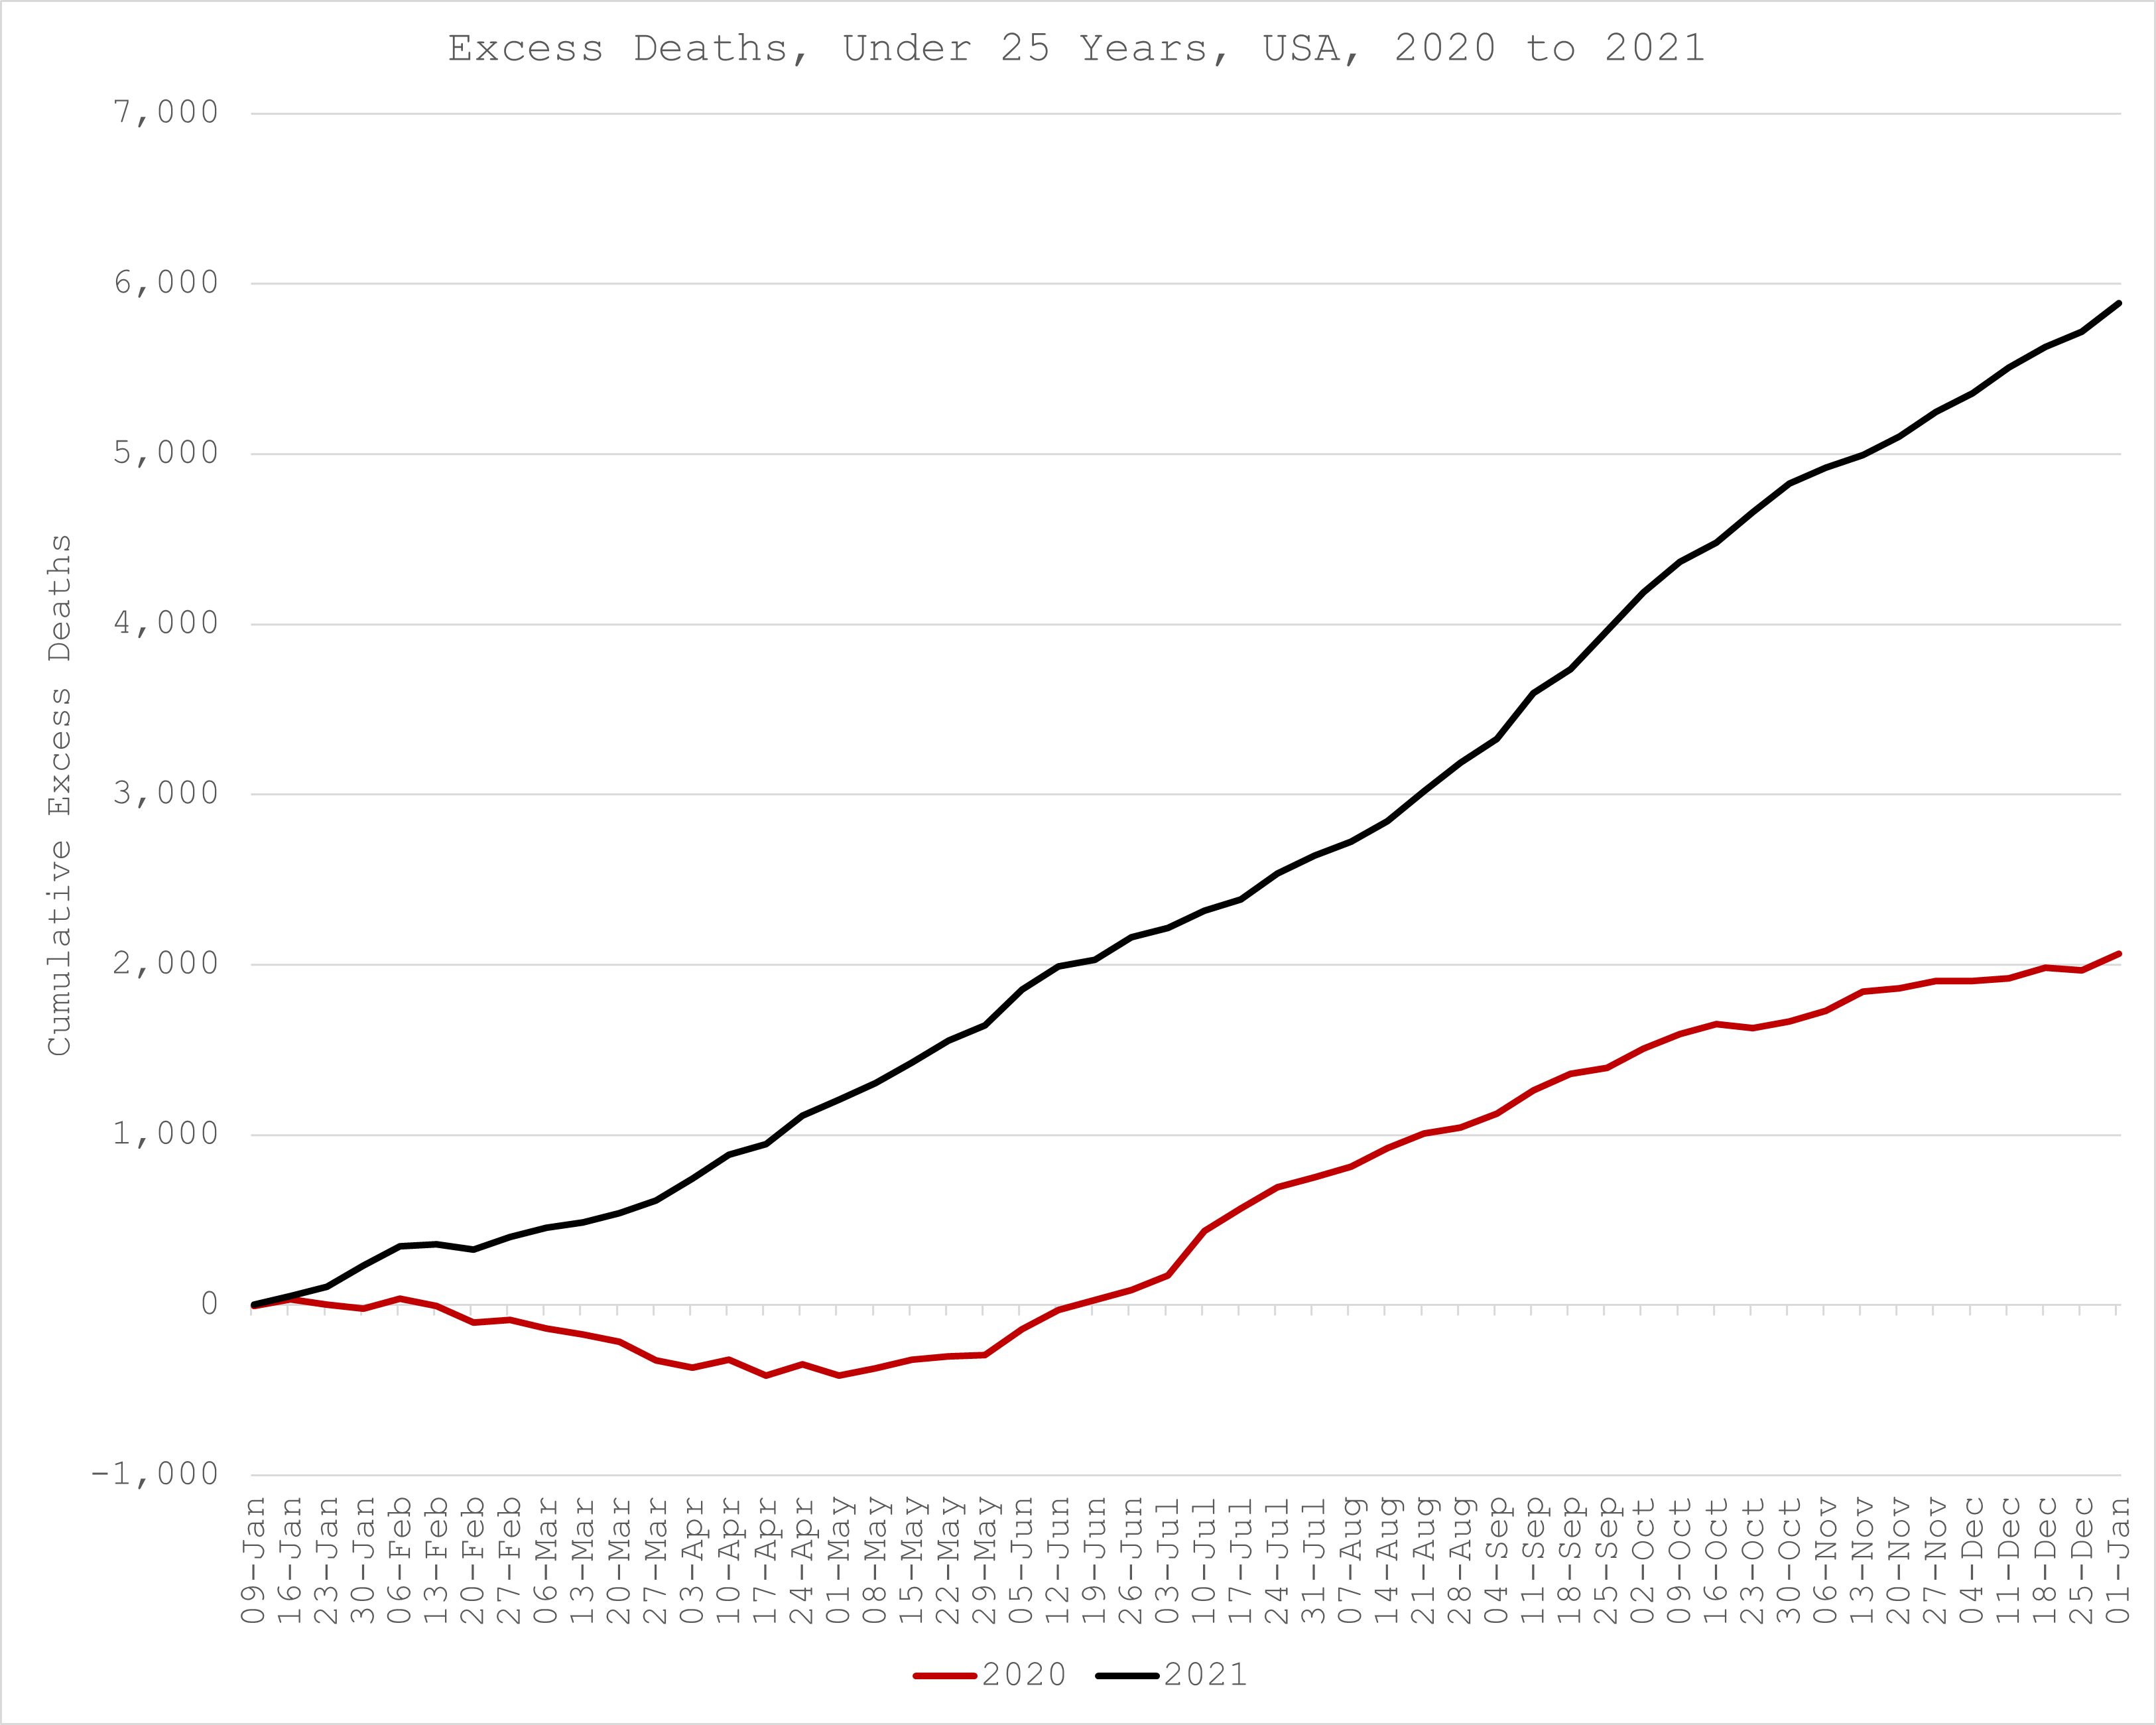
- excess deaths1As a certain number of deaths are statistically expected each week/month/year ‘zero’ excess deaths means people were dying in normal numbers. So, below the zero line indicates fewer deaths than expected, above indicates more than expected. in 2020 (when COVID was ‘new’) with
- excess deaths in 2021 (when the miracle shots came into action)?
Why is the “vaccine” year so much higher than the virus year and where is the declaration of a public health emergency?
Joel Smalley
His charts, explanations and resulting questions are worth the five minute read.
- 1As a certain number of deaths are statistically expected each week/month/year ‘zero’ excess deaths means people were dying in normal numbers. So, below the zero line indicates fewer deaths than expected, above indicates more than expected.